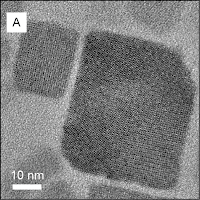
When you publish your research, you need to make good figures
using Illustrator, so I’m going to show a demonstration using simple data. We
will be using a TEM image.
How to start making a figure in Adobe Illustrator
 1. Load a .tiff image of a TEM picture and crop it into a
square shape using Photoshop. Take a note of the pixel sizes somewhere or
include it in the file name. This is important.
2. Open the Photoshop file in Illustrator. The picture will
be size-adjusted to 4cmx4cm in Illustrator.
3. Enter the 4cmx4cm size to the outline.
4. Set the line width to 0.5 pt if it isn’t already.
 5. Calculate the scale bar size from the pixel/cm length
ratio and add it in the picture. (like you see in the right)
6. Export the files (Click “file” then click “export”). Choose
any extension for the image file. Choose a relatively high-quality image. Add
it in the group meeting PowerPoint slide.
Your TEM data should look more professional now.
You can apply all data using the same steps. Make sure your the font in the figure is the same one you used in the PowerPoint.
Good luck on your TEM presentation!


